Table 1 is an abbreviated version of the initial ABMI data. This data was cleaned by dividing the measurements into 10 regions and creating a boxplot to find the outliers (see figure 6 & Map 2). In addition, due to trees under the age of 15 having very different grow patterns to older trees, all trees under that age were removed from the dataset.
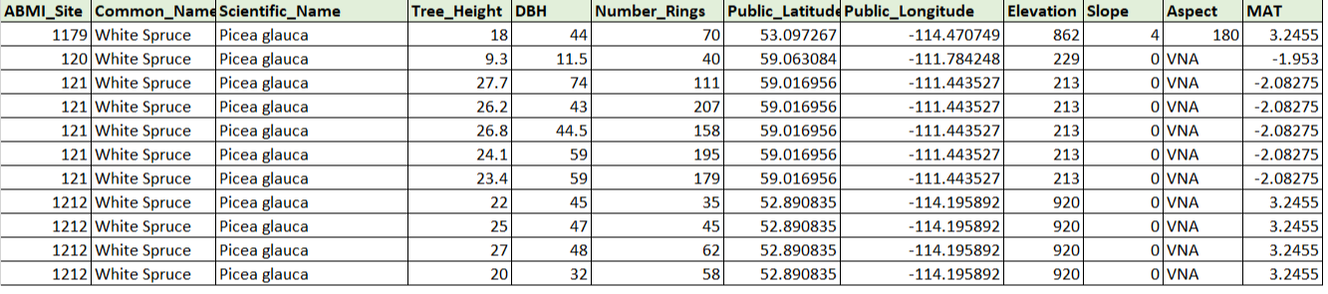
Table 1- ABMI raw data
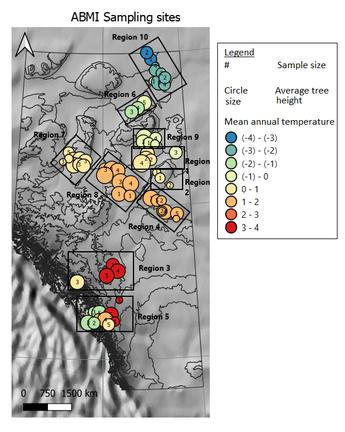
Map 2- Sample sites and relative average tree height
|
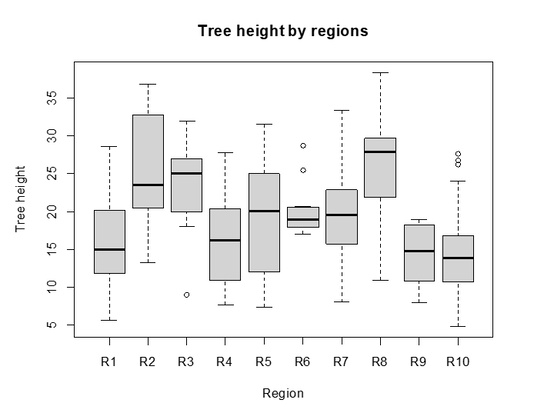
Figure 6- finding outliers in the data
|
In order to create the final table for analysis, I had to first normalize the tree height by creating a site index. To do that I plotted the tree height as a function of tree age and used the 'SparseM' r package to fit curves into the graph. The curves were fitted using the distribution of the data around the mean. This way a curve was created for the 0.05, 0.25, 0.5, 0.75, 0.95 quartiles (see Figure 7). After the curves were plotted each point was attributed to the closest curve and received the corresponding height at age 50 value (labeled 'N_HEIGHT'). Table 2 is the abbreviated version of the final table used for analysis.
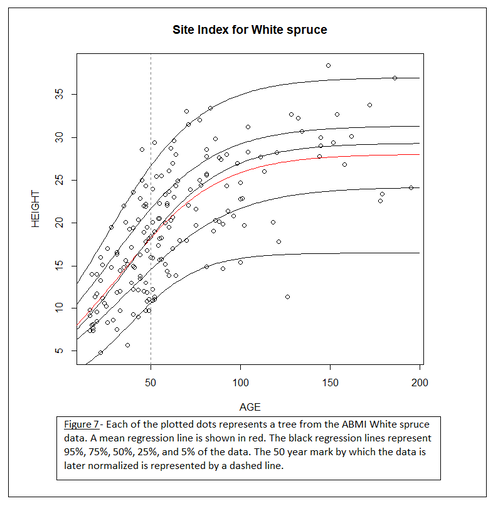
Figure 7- Created SI graph
|
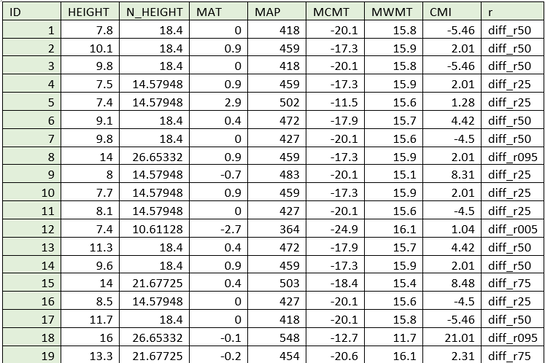
Table 2- Clean table. Outliers removed, normalized height calculated, and climate variables added.
|
Finally, I used the the created table to explore the relationships between the climate variables and the normalized tree heights. See the exploratory boxplots in figure 8. The chosen climate variables are: mean annual temperature, mean annual precipitation, mean coldest month temperature, mean warmest month temperature, and climate moisture index.
* The CMI represented in figure 8E and 13, is made out of the mean CMI value and an added constant of 6. This was done to create a scale of positive values for the visual representation.
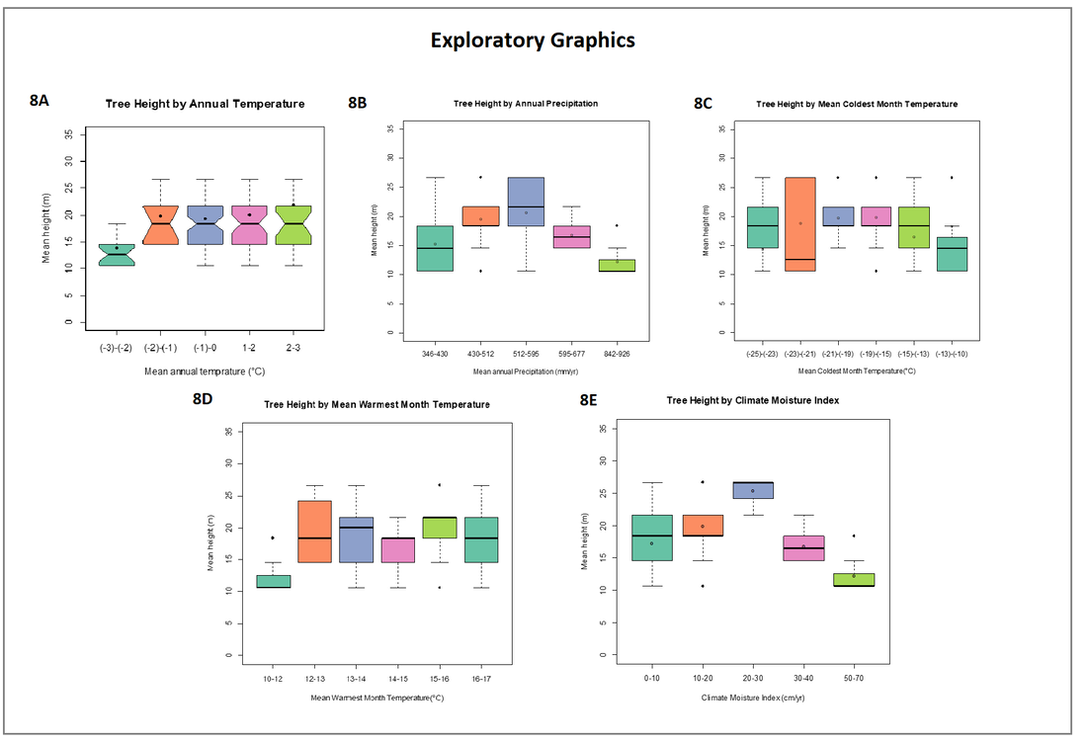
Figure 8- exploratory graphics of the selected climate variables
