In figure 9 the relationship between tree height and mean annual temperature (MAT) exhibits a weak positive trend. This indicates that temperature is indeed a limiting factor in white spruce productivity. The mean annual temperatures available in this dataset only go up to 3 °C, whereas the southern edge of the white spruce natural range in Wyoming US, has a mean annul temperature of roughly 4.2 °C. It is possible that at higher MATs, the height will show a decline, but given the available data, my hypothesis could not be confirmed. There is no evident optimal temperature range for white spruce productivity, rather a steady upward trend suggesting that productivity will increase the higher the temperature gets. With the possible decline at the southern edge aside, this result could indicate good news for western Canada. As previously stated, temperatures in Alberta are expected to rise significantly in the next decade which may lead one to expect an increase productivity. Unfortunately it is not that simple.
In opposition to the MAT result in figure 9, Figure 10 tells a different story. As expected, for the precipitation (MAP) effect there is an optimal range for white spruce productivity at around 550 mm/year. This is to be expected seeing as White spruce has mainly adapted to the drier climates of the boreal forests of North America (Hogg et al. 2017). Yet, an extremely arid environment also will not suit this species since it is very sensitive to drought (Hogg et al. 2017). Productivity declines somewhat under 500 mm/year and declines further under 400 mm/year. In this graph we see much steeper slopes, suggesting that the effect of precipitation is likely greater than that of temperature. This observation is reinforced by previous research that shows declines in productivity during drought periods (Mood et al. 2021).
Figures 11 & 12 allow us to further investigate the effect of temperature, with a closer look at the coldest and warmest months' effect on productivity. In figure 12 we can see a parabolic relationship, with productivity at its highest for -18 °C and a steady decline for both tails. This result stands in accordance with my initial hypothesis about the effect of temperature on productivity, thus for the cold tail we do not see the relationship suggested by figure 9, meaning that an infinite increase in winter temperature will not continuously increase productivity, but will eventually hinder it. This could possibly be attributed to tree pests and diseases which are killed by the cold winters allowing the trees to recover (Candau and Fleming 2011). It is important to note that the standard error bars for the measurement at -13 °C category (colored light green) are fairly high, meaning the trend of decline is likely mistakenly too steep. Figure 11 is not as straight forward and does not indicate an obvious trend. Both a linear trend and parabolic curve were tried for size to attempt to understand the nature of thr effect. Unfortunately, judging by the ACI there wasn't a clear difference between the fitted curve (ACI= 32.4) and the trend line (ACI= 31.04), thus making it hard to make inferences on the effect of warmest month temperatures. Generally speaking better productivity is observed at temperatures higher than 12 °C. This can easily be explained by looking at how metabolic rates are limited by temperature leading to a greater photosynthetic rates at warmer temperatures (Xu et al. 2007; Way and Oren 2010; Wertin et al. 2012).
Figure 13, which showcases the productivity as a function of Climate moisture index, reveals results similar to these of figure 10, with a strong parabolic relationship. This is to be expected since the climate moisture index is calculated by subtracting potential annual evapotranspiration from the overall precipitation, meaning that the smaller the values the drier the climate. We can clearly see an optimal value around CMI= 20 cm/yr, and a decline along the tails which, again, can be explained by white spruces adaptation to a drier climate, but at the same time by its sensitivity to drought.
Finally, looking at the correlations of the different climate variables interactions in figure 14, we see a strong correlation (either direct or inversed) within the temperature indicators, this is of course a given seeing as the MAT includes within it the information used for both MCMT and MWMT. The same can be said about the correlation of MAP and the CMI. The only interesting relationships indicated by the matrix is the slight inverse correlation of CMI-MWMT and MAP-MWMT. This can possibly be attributed to the known phenomenon of temperature induced soil drought (Liu et al. 2021). As the temperature rises, water evaporates faster from both the canopy and the soil, thus increasing the evapotranspiration and consequently lowering the CMI.
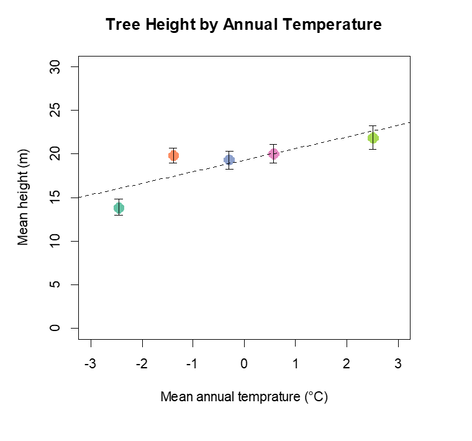
Figure 9- Tree height by MAT
|
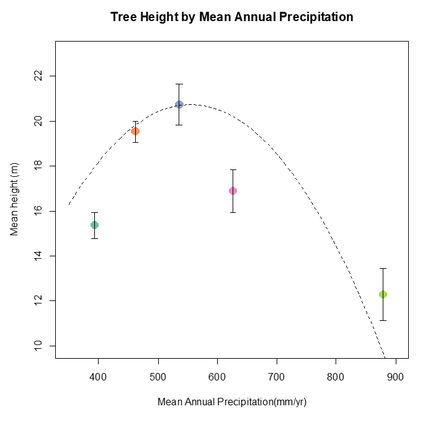
Figure 10- Tree height by MAP
|
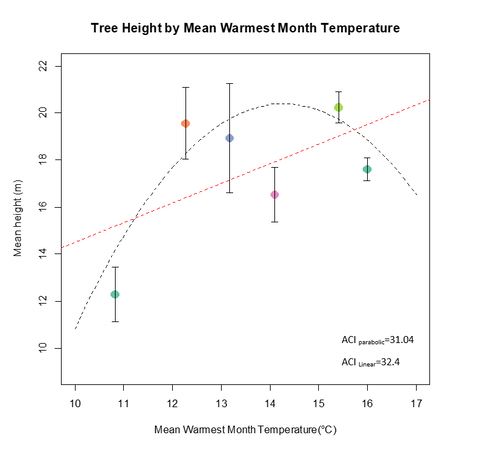
Figure 11- Tree height by MWMT
|
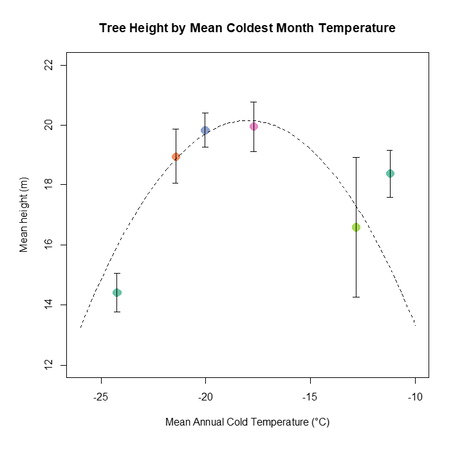
Figure 12- Tree height by MCMT
|
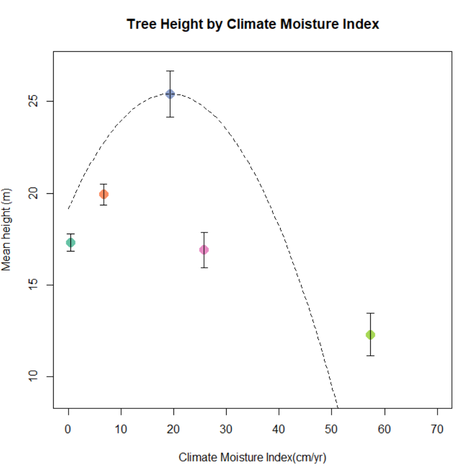
Figure 13- Tree height by CMI
|
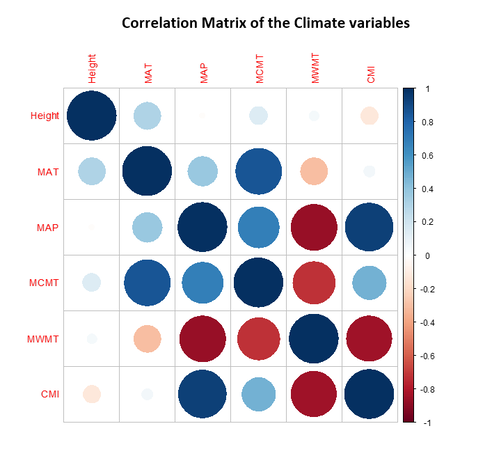
Figure 14- Climate variables correlation matrix
|
The results of my project show that for most climate variables, white spruce has an optimal range that needs to be conserved. The precipitation were shown to have a significant effect on productivity, more so than the effect of temperature. While temperature was shown to have a lesser effect, there was still a clear upward trend, suggesting a positive effect for productivity. An important distinction to make is that between winter temperatures and summer temperatures, since the former appears to have an important role in white spruce productivity, possibly related to insect control. The temperature effect represented in the graph may be misleading since we do not fully understand the higher end of temperatures effect on productivity. Further research will need to fill that gap. Overall the selection of seed for assisted migration may prove to be more complicated than initially thought. A special focus will have to be put on adaptations to drier conditions rather than adaptation to temperature.
