|
To assess the relationship between White spruce productivity and different climate variables, I analyzed tree height records sourced by the Alberta Biodiversity Monitoring Institute (ABMI) and climate records from the climateWNA website (see figure 3 & 4). The climate records were obtained using the latitude, longitude and elevation information provided by the ABMI for each sampled tree.
The data analysis was done using RStudio version R-4.1.1. |

Figure 3- ABMI website screenshot
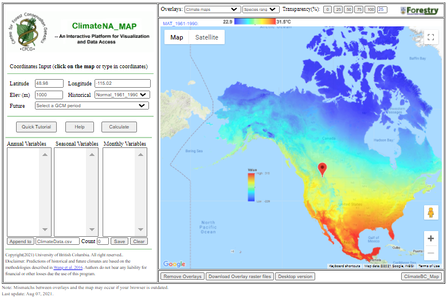
Figure 4- ClimateWNA website screenshot
|
In order to compare the tree heights a site index was constructed (See the Data page for a more elaborate explanation). This practice is widespread in forestry research as it allows to compare tree heights at very different points of the trees life. To do that, a graph of tree height as a function of age is created and several curves are fitted according to the spread of results. An index age is asserted (usually at 50 years) and used to normalize all the points to. Essentially, a curve is selected for each point by proximity and it's formula is used to find the corresponding parallel curve. Then, you find the height of this point at age 50 which serves as the normalized height for the comparison (see figure 5 for an example).
In order to compare the tree heights a site index was constructed (See the Data page for a more elaborate explanation). This practice is widespread in forestry research as it allows to compare tree heights at very different points of the trees life. To do that, a graph of tree height as a function of age is created and several curves are fitted according to the spread of results. An index age is asserted (usually at 50 years) and used to normalize all the points to. Essentially, a curve is selected for each point by proximity and it's formula is used to find the corresponding parallel curve. Then, you find the height of this point at age 50 which serves as the normalized height for the comparison (see figure 5 for an example).
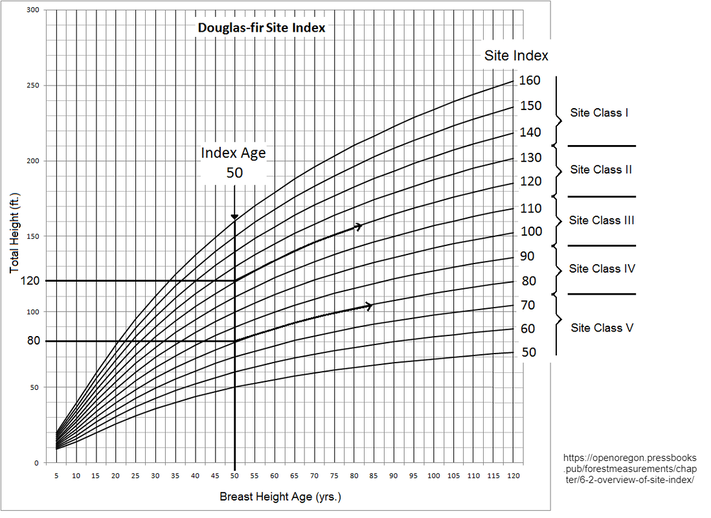
Figure 5- Example of Site Index
For this project, I simplified the site index normalization process by using the 50 year value of the closest curve rather than finding the individual curve of each point. This was done under the assumption that averaged values will provide the generalized trends I seek thus eliminating the need for the exact values.
